Reviewed by RouterFreak
Lab environment: Proxmox / GNS3 / Windows Server 2022 | Tested: March 2026 | Trial license provided for review purposes
What is WhatsUp Gold?
Progress WhatsUp Gold is a modern network monitoring platform from Progress Software that helps IT teams see, understand, and control their entire network by automatically discovering devices, visualizing dependencies, monitoring performance, and alerting on issues in real time, all from one intuitive web-based interface.
Beyond the core platform, WhatsUp Gold can be expanded to include traffic visibility, threat detection, and multi‑site operations. Network Traffic Analysis (NTA+) provides flow‑based insight into bandwidth usage and communication patterns and underpins WhatsUp Gold’s Network Detection and Response (NDR) capabilities by supporting the identification of suspicious or unexpected traffic behavior.
WhatsUp Gold 360 (WUG360) adds centralized visibility across multiple WhatsUp Gold instances and includes external connection monitoring to track network paths and connectivity beyond the local environment. Additional add‑ons such as Configuration Management and Log Management support configuration change tracking, compliance workflows, and log collection. For organizations that want the complete feature set, the Enterprise Plus edition bundles all available add‑ons into a single license.
Lab environment
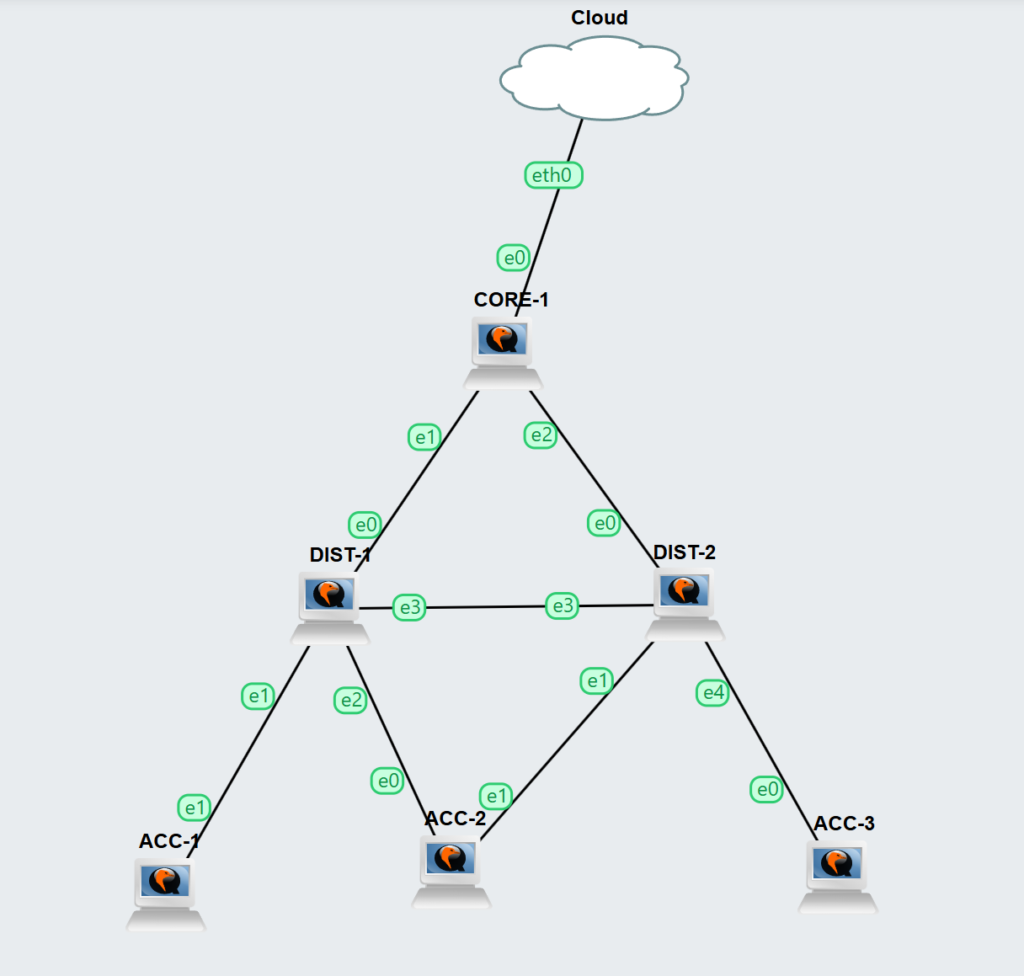
This review was done in a GNS3-based virtual lab running on a Proxmox server (Minisforum MS-01), with WhatsUp Gold installed on a dedicated Windows Server 2022 VM (192.168.0.50). The simulated network had six VyOS routers in a three-tier hierarchy: one core router, two distribution routers, and three access routers, all reachable from the monitoring server via static routing.
A note on SNMP: SNMP polling could not be validated in this GNS3 lab because of a UDP socket delivery issue specific to how VyOS handles packets inside QEMU-based virtual networking. That is a limitation of the lab setup, not of WhatsUp Gold. In production deployments with physical or standard virtual network devices, SNMP is a core WhatsUp Gold capability and should work as documented. All monitoring results in this review are based on ICMP (ping) polling.
Installation and initial setup
Installation on Windows Server 2022 is straightforward. The installer walks you through prerequisite checks, database configuration, and license activation. You can get a trial license directly from the Progress website without a sales call. It’s a small detail, but a welcome one.
After installation, WhatsUp Gold opens a browser-based console at https://localhost/NmConsole. The interface uses a clean dark header navigation with five main sections: Discover, My Network, Analyze, Settings, and NTA+. First impressions are good. The layout feels built for the job rather than generic.
Device discovery
WhatsUp Gold’s discovery wizard walks you through setting up an IP range scan. Options include ping sweep, SNMP, WMI, and SSH credential sets. For this lab, ping sweep was enough.
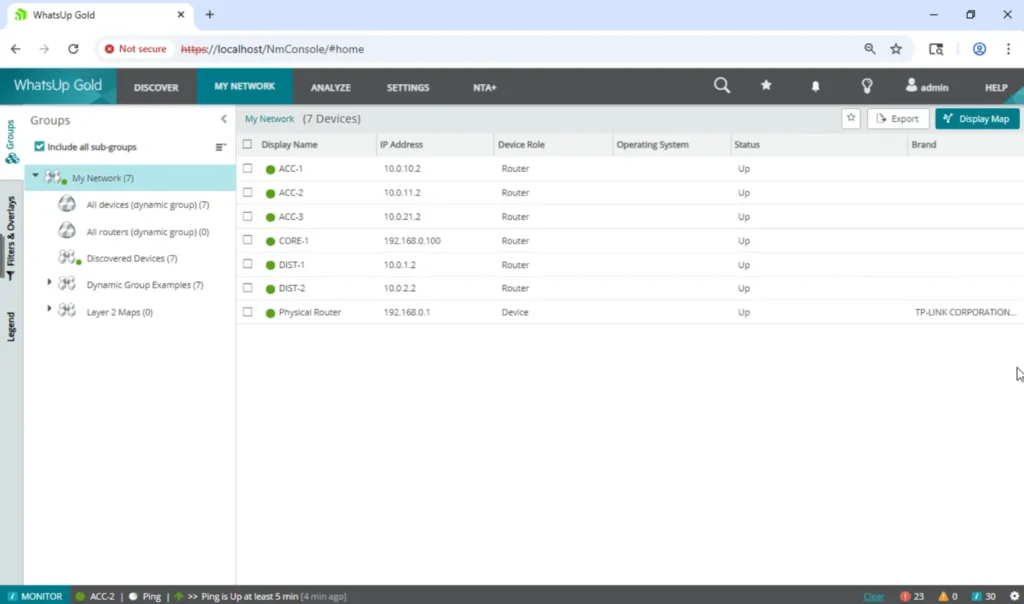
The scan finished in under two minutes across both the 192.168.0.0/24 and 10.0.0.0/8 address spaces. All seven devices were discovered automatically: the six simulated VyOS routers and the physical TP-LINK gateway on the local network. No devices had to be added by hand.
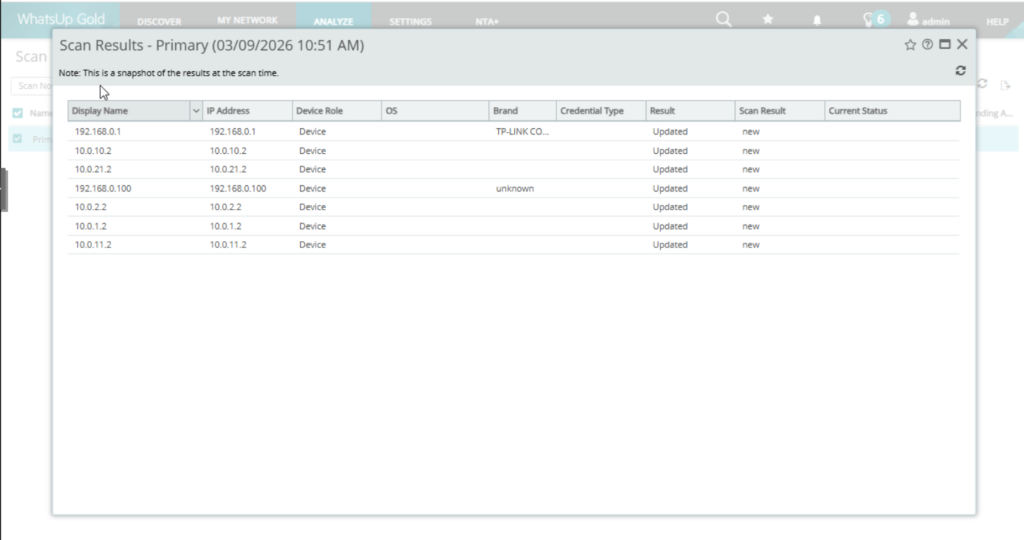
Device classification partly worked without SNMP. The TP-LINK router was correctly identified by brand using a MAC address OUI lookup. The VyOS routers were discovered and pinged successfully but were classified only as generic “Device” entries, with no OS or brand detection. That is expected without SNMP.
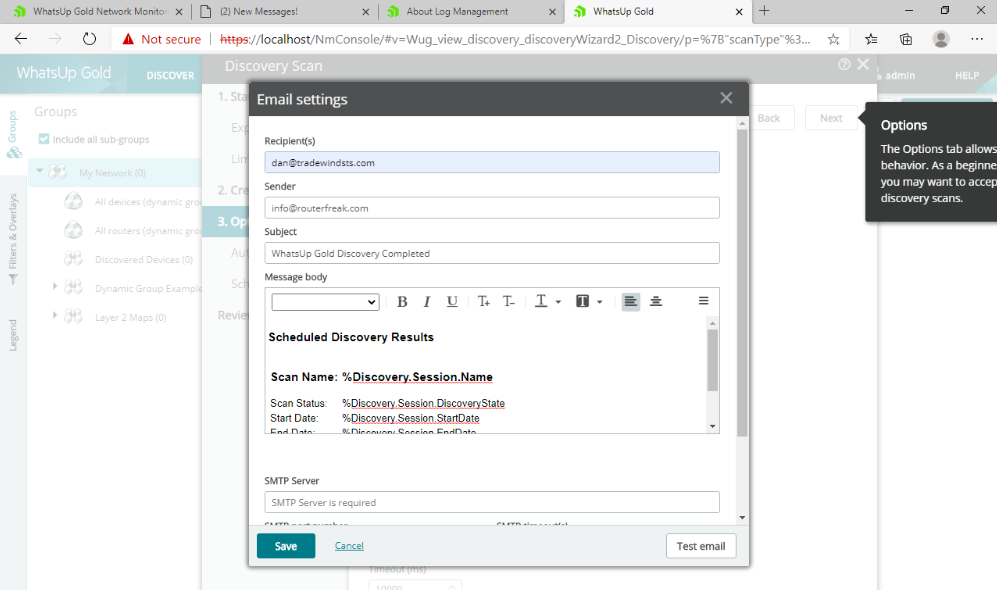
An optional email notification sends you the discovery results automatically when a scan finishes. The email includes dynamic token fields (scan name, status, start/end time), and you can schedule recurring discovery scans to keep the network inventory current. In environments where new devices are added regularly, this is a practical bit of automation.
One minor gap: display names defaulted to IP addresses rather than resolved hostnames. Renaming devices is easy in the device properties interface, but bulk rename or automatic hostname resolution would save time in larger deployments.
Device management
The device properties page does more than the sparse initial view suggests. Each device record has fields for display name, hostname, IP address, OS, brand, role, SNMP OID, and action policy, plus a left-hand navigation panel with Monitors, Polling, Actions, Credentials, Groups, Attributes, Roles, and Inventory sub-sections.
WhatsUp Gold also fills in a Notes field with discovery metadata (“This device was scanned by discovery on [date/time]”), which gives you a passive audit trail of when devices first appeared on the network. The “Keep Details Current” toggle tells WhatsUp Gold to refresh device properties continuously instead of relying only on the initial scan snapshot.
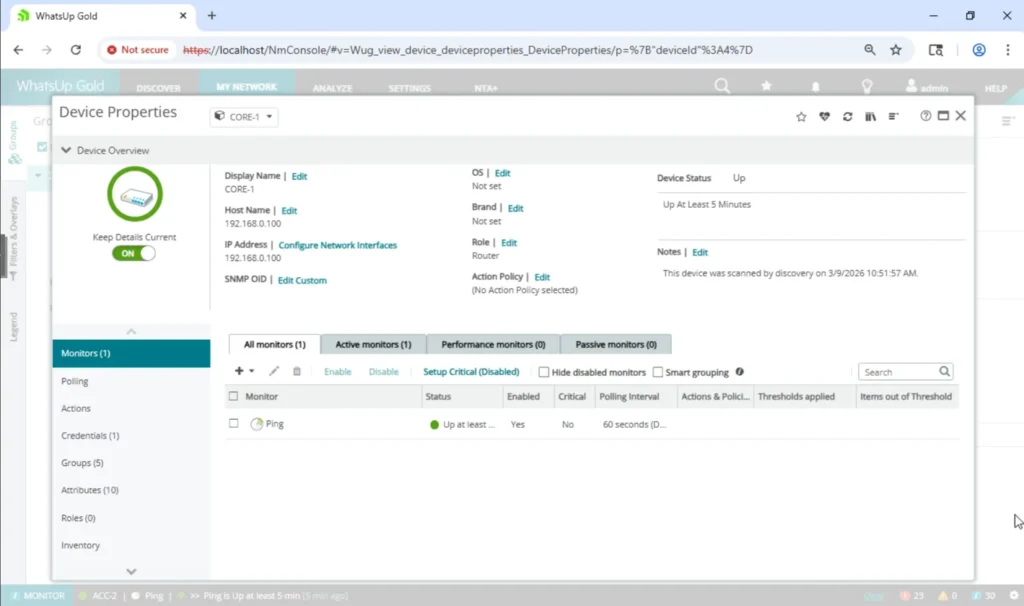
Ping monitors were assigned automatically to all discovered devices with a default 60-second polling interval. Monitoring started without any manual configuration.
Monitoring
ICMP-based up/down monitoring was reliable throughout testing. Devices were polled every 60 seconds, and status changes showed up in the interface promptly after each state change. The bottom status bar has a real-time event ticker, so you can keep an eye on events without leaving the current view.
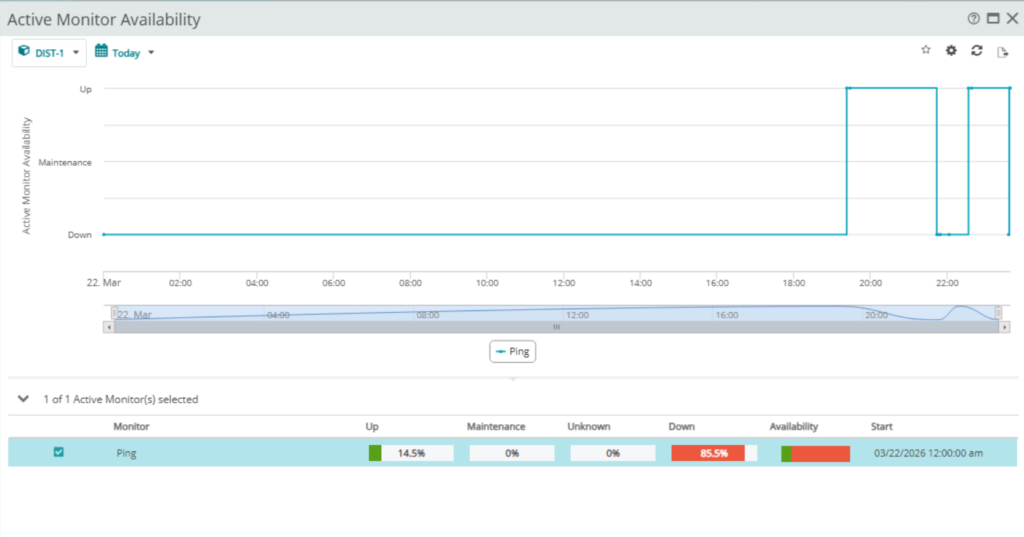
The Active Monitor Availability report shows a per-device timeline of up, down, and maintenance states over any selected time window. The summary row under the chart gives exact availability percentages, which is useful for SLA tracking and capacity planning conversations.
Without SNMP, interface-level metrics (bandwidth utilization, error rates, packet loss per interface) are not available. WhatsUp Gold’s full monitoring covers CPU, memory, disk, and interface statistics via SNMP and WMI, but this review could not validate those features in the lab environment.
Alerting
Alerting uses a two-step model. First you create an Action (what to do: send an email, run a script, post to a URL), then you create an Alert Policy (when to trigger it: device state changes, threshold crossings, and so on).
Setting up a basic down alert meant going into Settings, creating an email action with recipient, sender, subject, and SMTP server details, and then attaching that action to a trigger condition. It took about five to ten minutes with no prior familiarity with the interface.
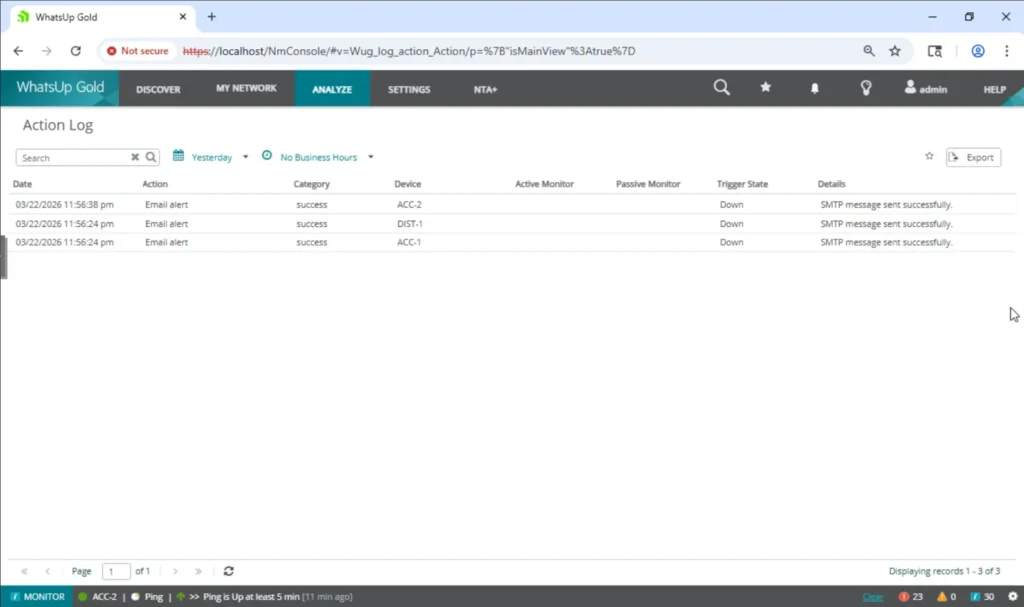
In testing, three devices were taken down at the same time. WhatsUp Gold sent three separate email alerts within seconds of each other, and the Action Log showed all three as successful. The alert emails included the device name, assigned role (Router), the specific monitor that failed (Ping), and a direct link back to the device status dashboard.
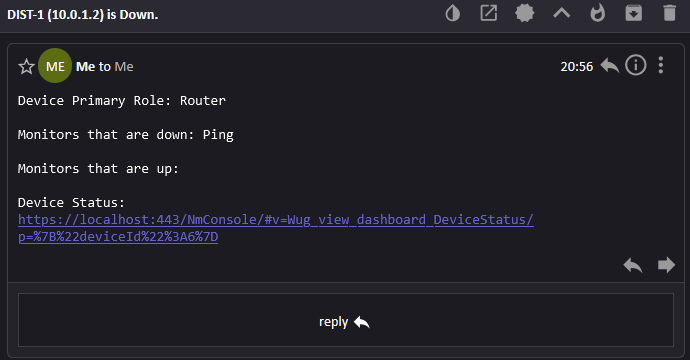
One practical issue: the device link in alert emails points to https://localhost/NmConsole/.... If administrators read email on a different machine than the monitoring server, this link will not resolve. Configuring WhatsUp Gold with a proper hostname or IP-based URL would fix this.
Dashboards
The default Home Dashboard is useful right away, with no customization. That isn’t always true of enterprise monitoring tools. Out of the box it includes:
- Current Device States: a color-coded tile grid showing device counts by status (Up, Down, Maintenance, Unknown)
- Enabled Active Monitors: a bar chart of monitor status across the network
- Device Role Composition: a pie chart of the device types discovered
- Network Coverage: a gauge showing the percentage of discovered devices currently being monitored (100% in this lab)
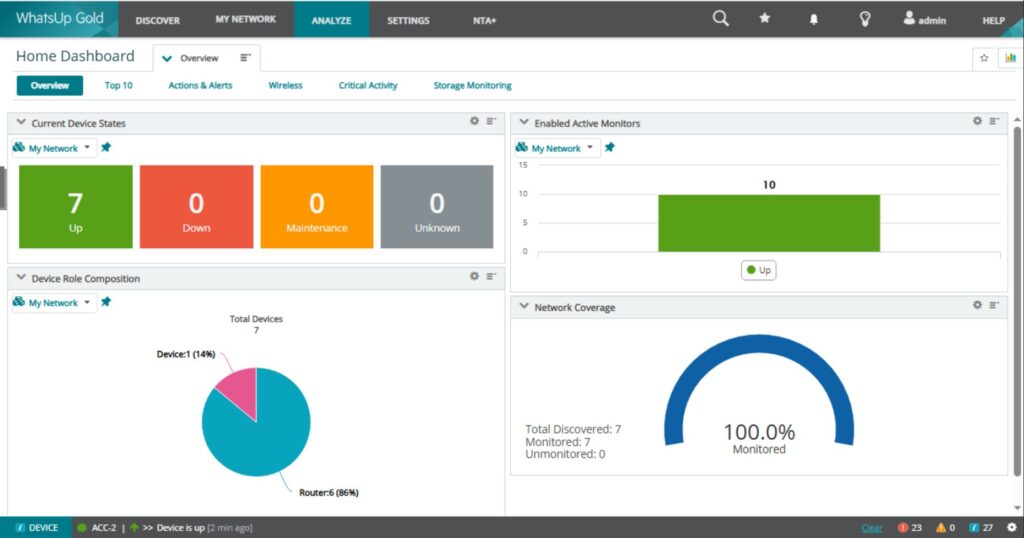
Five more pre-built dashboard tabs are available: Top 10, Actions & Alerts, Wireless, Critical Activity, and Storage Monitoring. Between them they cover the most common NOC use cases, so you don’t have to build custom dashboards from scratch.
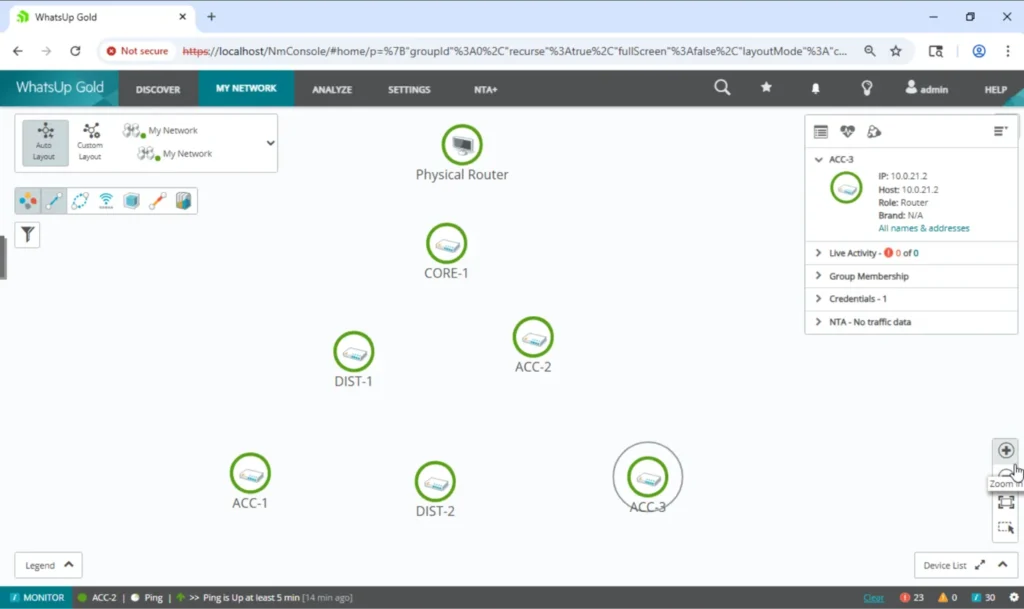
The network map view (opened via Display Map from the device list) supports drag-and-drop device placement, so administrators can arrange devices to mirror the physical topology. Devices show their configured names rather than raw IP addresses, which keeps the map readable once devices are properly labeled. Clicking any device opens a right-side detail panel showing IP, hostname, role, brand, live activity, group membership, credentials, and NTA status. It’s a useful quick reference that doesn’t take you out of the map view. Without SNMP, topology links between devices are not drawn automatically, so placement and connections must be set manually.
Reporting
WhatsUp Gold has a solid built-in reporting engine. Reports export to HTML, Excel, CSV, and plain text, which covers most enterprise reporting and integration needs.
Scheduled reporting adds useful automation. Configuration options include:
- Intervals: Daily, Weekly, Monthly, Yearly, and Custom, with control over the start time
- Delivery: By email or to a directory path, so reports can go to file shares, SharePoint, or downstream reporting pipelines
- Format options: HTML with an optional “embed in email body” toggle (useful for executive recipients who prefer not to open attachments), plus ZIP compression for large reports
- Test delivery: A “Send Test Report” button checks the configuration before you commit to it, so scheduled jobs don’t fail silently
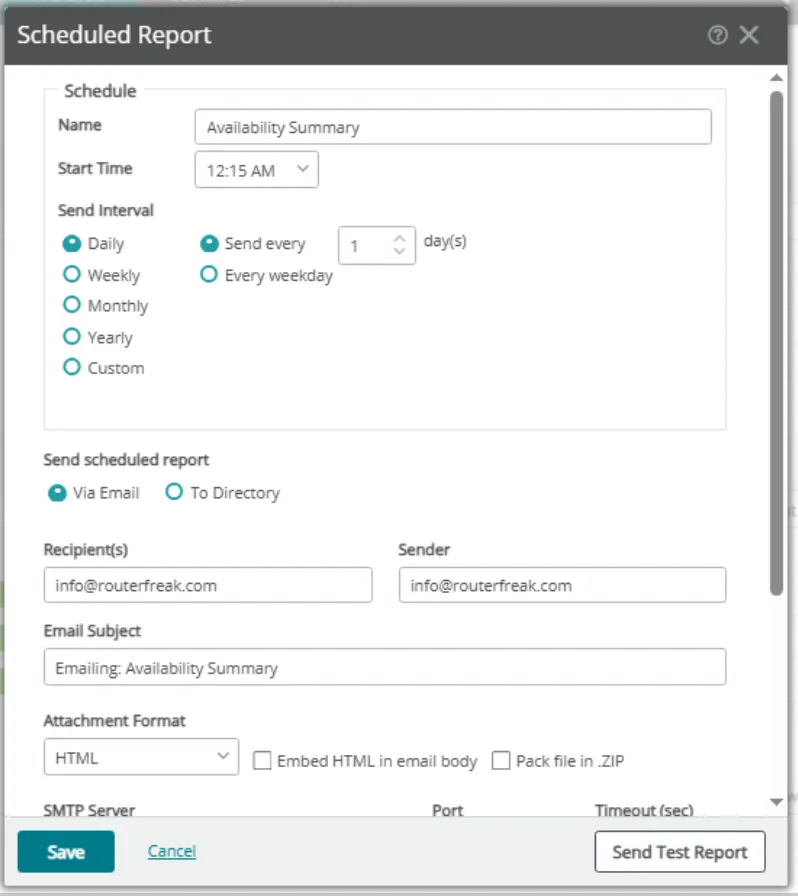
With directory delivery and flexible scheduling, you can feed WhatsUp Gold reports into existing enterprise reporting workflows without custom scripting.
Usability
WhatsUp Gold’s interface is functional and well organized, though it takes time to learn. The navigation is logical, and the dashboard-first layout puts the most operationally relevant information up front. More advanced configuration (custom monitors, action policies, credential sets, threshold rules) means digging deeper into the menus and learning the product’s terminology.
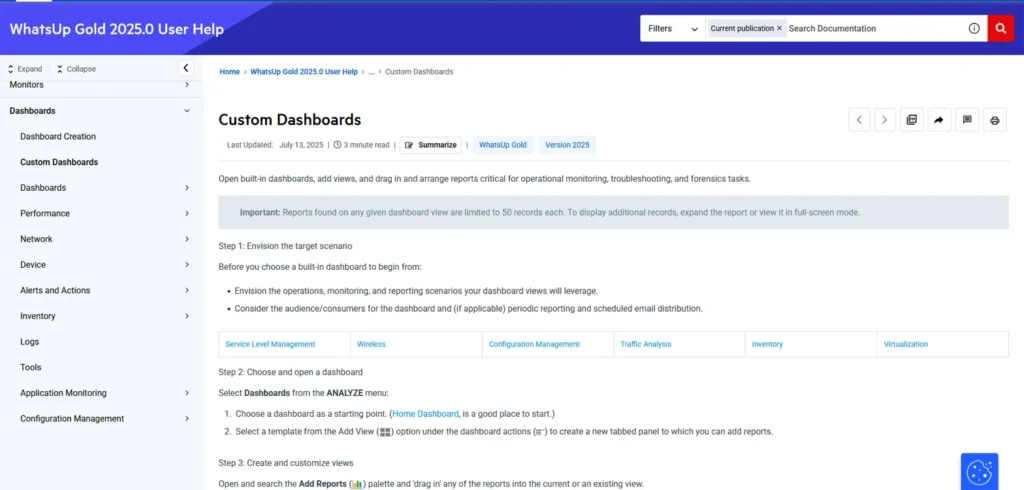
The documentation is technically accurate and thorough at the field level. Pages like the Custom Dashboards guide walk through a logical three-step process and cover scenario planning, template selection, and report customization. The gap is workflow-level guidance for newcomers. The documentation explains what each option does but rarely shows how to combine them for common first tasks, like setting up a first down alert or building a basic SLA report.
The YouTube channel with quick-start videos and a free on-demand “Get Started with WhatsUp Gold Administration” course partly fill the workflow guidance gap. Linking to these resources from inside the product UI would make onboarding noticeably easier.
Verdict
Who it’s for: IT teams managing networks of 25 to several thousand devices who need reliable on-premises monitoring with strong alerting, built-in reporting, and the option to add modules later. WhatsUp Gold fits organizations that need audit trails, scheduled reporting, and role-based device management, particularly in regulated environments.
Who might look elsewhere: Very small teams or home lab users may find the setup overhead and Windows Server requirement more than they need. Fully cloud-native teams may prefer SaaS monitoring alternatives.
Pros
- Fast, automatic device discovery via ping sweep
- Reliable ICMP-based up/down monitoring with accurate alerting
- Clean, information-dense default dashboard
- Flexible scheduled reporting with email and directory delivery
- Action Log gives a clear alert audit trail
- Modular design lets you add capabilities without switching platforms
- Free training course and YouTube quick-start videos
Cons
- Full capability requires SNMP, which adds configuration overhead
- Alert email links default to localhost, so remote access needs manual hostname configuration
- Documentation describes fields well but lacks end-to-end workflow examples
Bottom line
WhatsUp Gold does what it promises: reliable network monitoring with useful alerting and flexible reporting. Initial setup asks more of the administrator than some competitors do, but you end up with a capable platform that can be extended as the network grows. For teams that need more than a ping dashboard and are willing to put time into proper configuration, WhatsUp Gold is a strong option.